Part 2: Why Infor Birst? This post explores why Birst was uniquely qualified to meet the needs of...
Keys to Successfully Creating a Birst PPE Inventory Dashboard Set in a Week, Part 3

Part 3: Why did we succeed?
This post will examine Birst’s Big 6, the key drivers of analytics success, and how the presence of these elements helped to ensure this project’s success. Parts 1 & 2 laid out the client’s requirements for the project, showed each of the dashboards, and described why Infor Birst was the right tool for the job. Part 4 will lay out, step by step, how the solution was developed using Infor Birst.
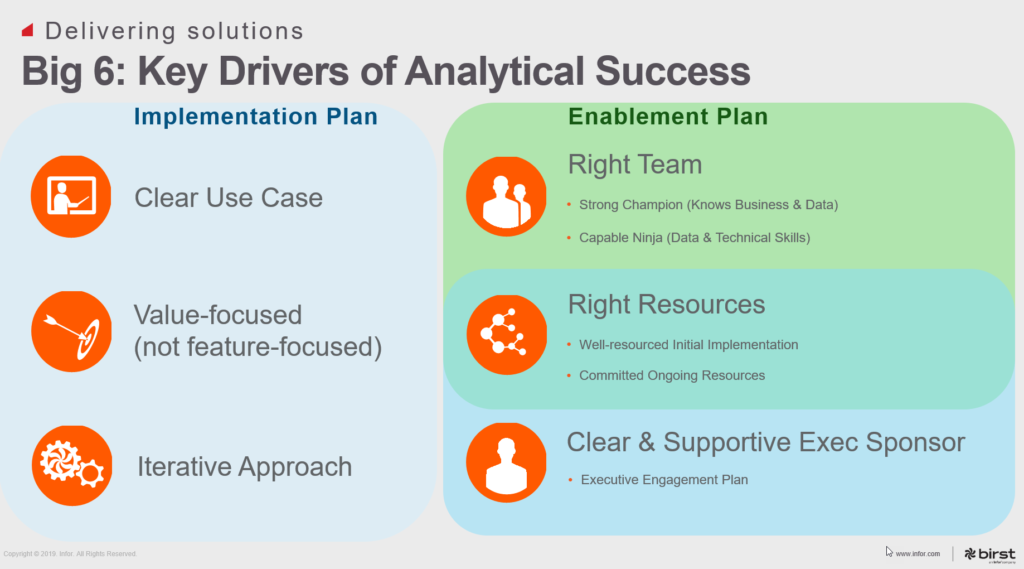
You may have seen the image above in a presentation given by someone from Infor Birst. Or perhaps you are new to Birst and are seeing this for the first time. It’s the kind of slide that can easily be dismissed as marketing spin and not be given a second glance. But it’s actually a really valuable roadmap to project success.
It lays out what Birst refers to as the “Big 6”. These are the 6 drivers that are critical to have in place whenever embarking on any analytics project, and I would argue that these are key factors for any development project! With over 20 years of experience developing data warehouse and analytics solutions, I can tell you I have been on many projects that have not succeeded, and in all cases I can confirm that one or more of these factors were missing.
In this PPE Inventory Dashboard project, having these factors in place ensured that the project proceeded smoothly and very rapidly, enabling a Go-Live in under a week!
- Clear use case:
- The use case was focused on answering specific questions – do we have enough of each of these critical items to meet the increased demand now and in the near future?
- They were not trying to build a solution that could answer every conceivable question related to inventory, purchase orders, and requisitions for all products in their warehouse.
One of the things that block developers from completing analytics projects is the “neverending requirements list”, and the idea that the solution is no good to anyone unless it covers EVERY. SINGLE. USE CASE. their business may have. This client avoided that black hole by making sure every data item they included was critical to answering their focusing use case. They didn’t throw in any data because they “might need it someday.”
- Value focused, not feature focused:
- The client focused on getting the information they needed, not on the specific way the information was being presented.
- Their goals were clarity and accuracy, not bells and whistles.
For example, not once did anyone say “We need a heat map” or “We need a bubble chart” – both of which are fine visualizations, but they are only appropriate in very specific circumstances. We’ve seen too many clients specify that they want a tree map or funnel diagram and then end up with a visualization that isn’t really meaningful. They are often over-used to create pretty dashboards that answer questions no one is asking.
- Agile, iterative approach:
- We got started on development immediately using a sample spreadsheet that was provided. While the spreadsheet was not an exact replica of the source system’s data feeds, it was enough to help us understand what the data would look like and what kind of questions it could answer. We used it to get started and then iterated on it as we got more information.
- Once the client had them available we easily switched to consuming the automated twice daily output of the data set into flat files.
- Prior to User Acceptance Testing (UAT) and again just before go-live, the client included personnel from Agile Dragon Consulting and Infor Birst to participate in their internal training session, allowing them to immediately provide answers to questions while gathering information needed to plan any future releases.
- Once the solution was delivered, we again easily switched to database connections and incremental queries instead of the full flat-file loads, enabling data extraction and publishing every 2 hours (and it could be done more often – it only takes 4 minutes and with Birst’s Always On feature their end-users aren’t impacted at all).
- Later we modified an existing script to capture a snapshot of their inventory data each day, which can be used to create trending of On Hand inventory amounts over time once a few weeks of history have been captured.
- The right team:
- On the Client’s team:
- Stakeholders and business process subject matter experts (SME’s) defined clear goals for the implementation and documented specific business rules and user requirements prior to engagement.
- Their Technical SME provided sample data files immediately and then created twice daily file outputs. They were readily available to assist with access to their environment for setting up Birst Connect 2.0, getting information about the source systems, managing and granting user access within the current Solution Structure, etc.
- The Client Project Manager coordinated participation by all necessary stakeholders and resources, making sure the right people were available at the right time.
- Infor Birst Consulting Services:
- Before the project even began, Infor Birst’s Services team collaborated with the customer to do the initial scoping and data discovery/validation. Furthermore, their coaching of the client enabled them to be ready to engage with no delays at the start or throughout the project.
- Agile Dragon Consulting:
- We focused on rapidly building and developing the solution, not validating requirements or doing in-depth validation of the results.
- Our goal was to get it done RIGHT and get it done QUICKLY.
- The strong participation by other players allowed Agile Dragon Consulting to find the quickest point from start to finish without the burden of massive amounts of uncertainty that often weighs down projects.
- On the Client’s team:
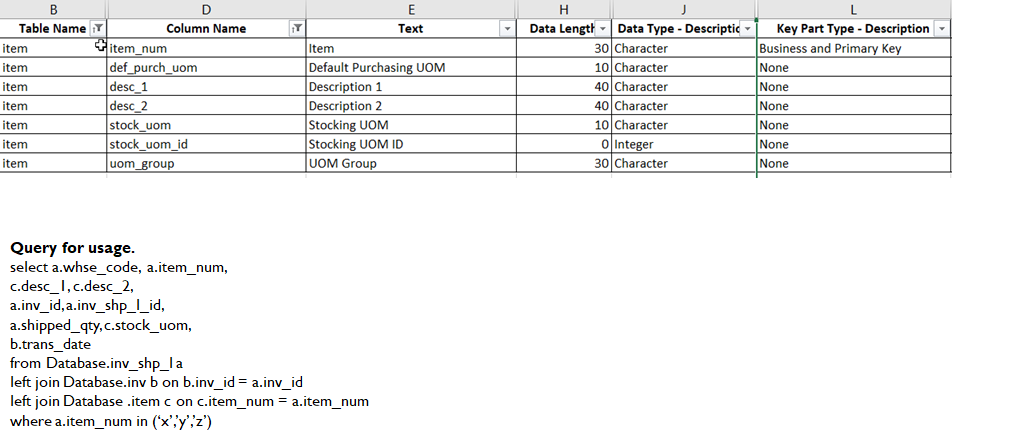
The client provided us with a data dictionary, which made it easy for us to translate the sometimes indecipherable column names (def_purch_uom) into usable business facing column names (Default Purchasing UOM).
FYI, UOM stands for “Unit of Measure”, something I learned fairly recently!
They also provided us with a few sample queries which vividly documented for us how the various tables would join together. It also gave us some targets for validation – if the results of a Birst report for including these columns matched the output of this query then we knew the modeling was correct and the data in Birst was an accurate reflection of the source system data.

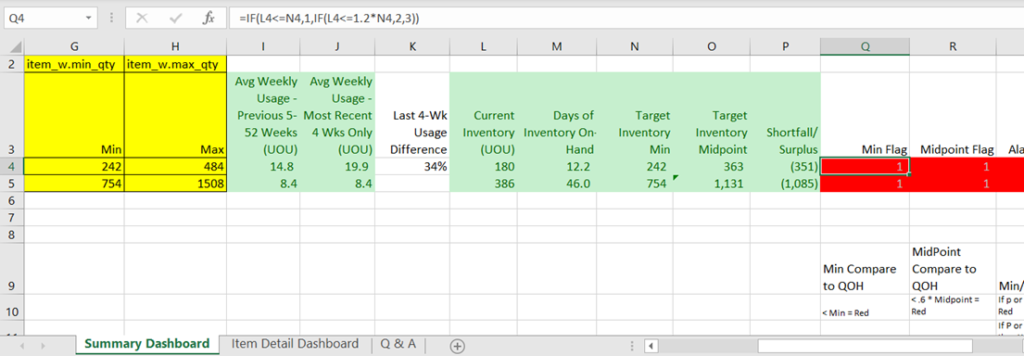
Finally, they gave us their basic report, chart, and dashboard requirements in the form of a sample spreadsheet. This was extremely useful because it allowed us to easily document the columns needed, it gave a clear definition of any formulas, and it gave us some examples of the output that we were able to refer back to.

- The right resources – prioritized appropriately:
- The necessary participants from Agile Dragon Consulting, Infor Consulting Services, and the client participated in daily 15-30-minute “standup” meetings to ensure the project moved forward quickly with no blockers.
- Following each standup, the client PM identified and documented daily to-do’s and communicated them clearly to all involved parties.
- The client made sure that the appropriate personnel were available at a moment’s notice when needed to support the project.
They even engaged people from the 3rd party system for a midnight meeting when needed to troubleshoot a technical issue!
- Clear and supportive client Executive Sponsor:
- The client Executive Sponsor made sure the appropriate people were available over the weekend to participate in User Acceptance Testing (UAT).
- They focused their feedback on making sure the needed information was being clearly conveyed, rather than focusing on non-material minutiae such as which exact shade of blue was being used or whether the embedded filters should be on the left-hand side or the right-hand side.
- They quickly and decisively gave the ok to go live and followed up with user feedback in the days immediately following the enablement in production.
For more information on the Big 6, read this (somewhat old) post by Paul Staelin, formerly of Birst who, as far as I know, was the originator of this concept.
Note: Following the completion of this project, Agile Dragon Consulting anonymized the data, removing all traceability back to the customer or the original source. A separate example space was created so that this information could be shared without compromising data privacy in any way. In the few examples where the requirements or precursor spreadsheets are shown they will be clipped to hide any sensitive information. Otherwise all screenshots and examples in this and future blog posts will be from this example space, not from the actual client’s solution.
Next Steps: In Part 1 of this blog series I laid out the client’s requirements for the project and showed each of the dashboards. Part 2 examined why Infor Birst was uniquely suited to be the perfect platform for the project. Finally, in Part 4 I will lay out, step by step, exactly how the solution was developed using Infor Birst.
