
Infor Birst’s Big 6: Key Drivers of Analytical Success slide Part 3: Why did we succeed? This post...
Part 2: Why Infor Birst?
This post explores why Birst was uniquely qualified to meet the needs of this specific project. In Part 1 of this blog series laid out the client’s requirements for the project and showed each of the dashboards. Parts 3 and 4 will explore why we were able to succeed in completing this project on time, to the complete satisfaction of the client and will lay out, step by step, exactly how the solution was developed using Infor Birst.
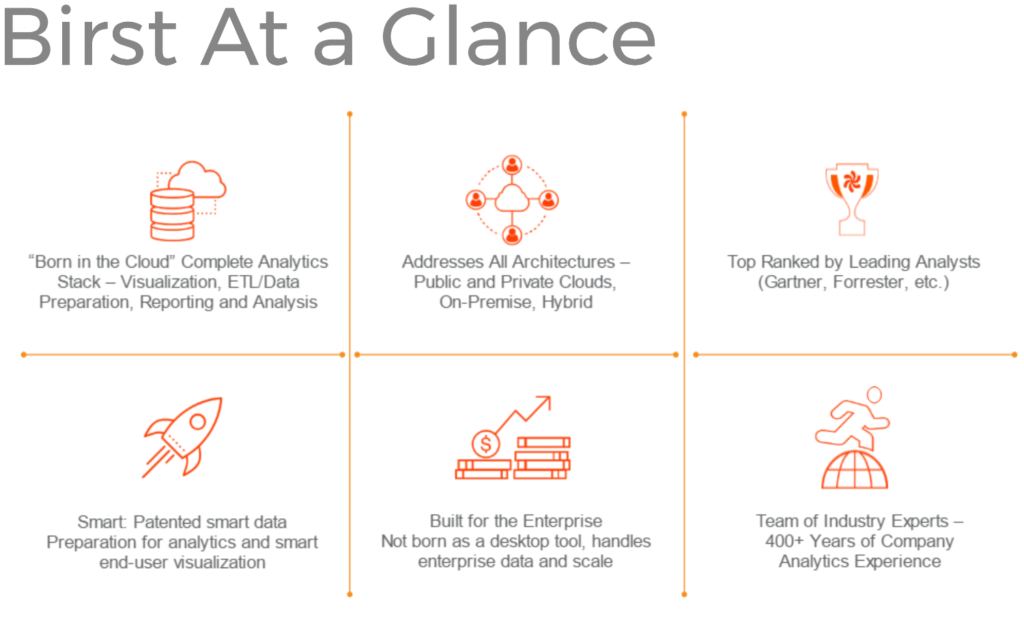
I feel as though new visualization companies sprout up like mushrooms, seeming to appear out of nowhere. While there are plenty of dashboarding options available, Infor Birst has a unique combination of features that made it the perfect choice for this project.
- By using Birst, their entire solution could be built on a single platform.
- The client needed to extract the data from their source system which was behind their firewall and make it available in the cloud where their users could access when they weren’t behind the firewall.
- They needed to capture daily snapshots of their Inventory On Hand counts, something their source system was not capable of doing.
- The data source itself actually wasn’t firmly set at the beginning of the project – it changed from Excel to flat files to a direct database connection. (I will explore this more in part 4 of this series.)
- They needed to create visualizations and connect them together on dashboards that enabled their users to filter as needed, drill down to view more detail, and export to their desired format.
- And they needed the dashboards to be both quick to load and responsive to different screen sizes.
- A Birst Cloud Agent (aka Birst Connect 2.0) was set up via a simple download and installation. This was initially used for accessing data in flat files and was later changed to directly access their Oracle database.
- A Birst Shared Connection was created so that this same Cloud Agent could be used in the DEV, UAT, and Production environments (Birst spaces), and could be used for Excel, flat file, or database loads.
- A robust ETL process (Extract, Transform, Load) and data warehouse model was quickly implemented using Birst 7.3 Modeler’s Connect, Prepare, and Relate features.
- Birst’s flexible and easy-to-use administrative features made it very straightforward to deploy to production and make available to end-users, using features such as space copying, swapping, and user groups.
- he user consumption layer was created in the form of Visualizer reports and charts, brought together with KPI’s on interactive Dashboards.
I can’t think of any other single-platform solution that would meet all of their needs the way Birst did!
- They were already licensed for it.
The client was in the middle of a larger Lawson/Birst implementation and already had an Enterprise Plus license. The source data needed for this project was not from an Infor product and was therefore not included in one of the Pre-Built dashboard sets that Infor has included in many of their solutions. Yet the power of Birst is that it can access data from almost any source and a model can be quickly built to reflect their business model.
- Birst’s easy-to-set-up user access and security
One of the great features of Infor’s Cloudsuite products is the use of a collaboration platform they call Mingle. A seamless experience is created by connecting all of their customer’s Cloudsuite information in one place along with other collaboration features, one of which is Birst. The client was able to quickly enable these new Birst dashboards for their users to access via Mingle.
However, they also had users who did not have access to any of the Infor products because it was not a part of their normal job duties. The flexibility of Birst made it a snap to grant access to these users directly via the Birst login page in Chrome while still applying the appropriate security model given their role.
Next Steps: In Part 1 of this blog series I laid out the client’s requirements for the project and showed each of the dashboards. Part 3 will explore why we were able to succeed in completing this project on time and to the complete satisfaction of the client. Finally, in Part 4, I will lay out, step by step, exactly how the solution was developed using Infor Birst.
Note: Following the completion of this project, Agile Dragon Consulting anonymized the data, removing all traceability back to the customer or the original source. A separate example space was created so that this information could be shared without compromising data privacy in any way. In the few examples where the requirements or precursor spreadsheets are shown they will be clipped to hide any sensitive information. Otherwise all screenshots and examples in this and future blog posts will be from this example space, not from the actual client’s solution.