
Working with Folders in Birst
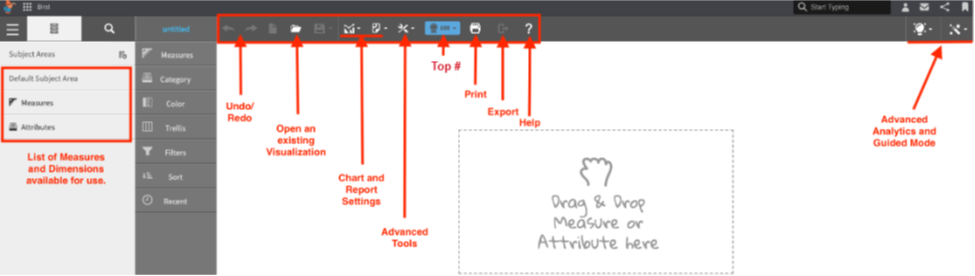
Welcome to our article where we will discuss navigating Birst Visualizer, a powerful tool in Birst that allows you to create charts, graphs, and tables. Visualizations in Birst are built from a Birst data set which lives in a Birst space. From the Visualizer home screen, there are some key features that you should take note of:
- Left side:
- Default subject area.
- This is where you choose measures and attributes that are available in your Birst space to use to create visualizations.
- Across the top
- Ribbon toolbar
- Undo & Redo buttons
- Open button - accessing existing visualization
- Chart Settings - applying different ways to format the visualization.
- Report setting – switch between report level or database level query
- Advanced Tools – BQL Editor, Query viewer, Log History, Report Level Drilling and mor
- Top Number of Results for the Visualization
- Export
- Quick Tour Help
- Advanced Analytics
- Change Visualization Type
- Ribbon toolbar
- Default subject area.
Key Takeaways
- Visualizer is a powerful tool in Birst that allows you to create charts, graphs, and tables.
- The default subject area is where you choose measures and attributes to create visualizations.
- The ribbon at the top of the screen includes advanced tools and settings for formatting your charts and reports.
Understanding Default Subject Area
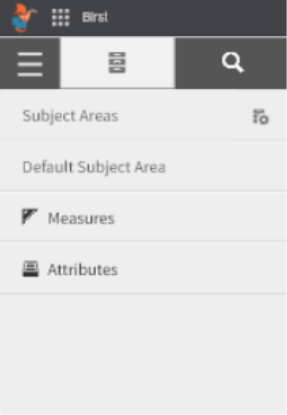 The Default Subject Area is located on the left- hand side of the screen. This area allows us to choose from a range of measures and attributes available in our Birst space to create visualizations.
Measures are data in our Birst space that we can use to perform aggregations, such as sum, average, or maximum value.
Attributes, on the other hand, provide context to measures.
For instance, if we want to see the total value of sales broken out by region, the value of sales would be our measure, and the region would be our attribute.
Measures and attributes are organized into folders, which we can access through the Default Subject Area. To build a visualization or table, we simply drag and drop the desired measures and attributes onto the canvas. The canvas is where we can see what is being displayed in our visualization.
We can also apply filters and sorting to our tables by dropping a column onto the filter section or the sort of section. The ribbon on the left-hand side of the screen displays what is being displayed in our visualization. As we add more attributes and measures to the ribbon, we can drag and drop them into different positions.
In summary, the Default Subject Area is where we spend a significant amount of our time when creating visualizations in Birst. It contains all the measures and attributes that we can use to build a table, chart, or graph. With the help of the canvas and ribbon, we can easily drag and drop the desired measures and attributes to create visualizations that provide insights into our data.
Building a Visualization
Visualizer is a tool that allows users to create charts, graphs, and tables. Visualizations can be independent or presented onto a dashboard. These visualizations are created by dragging fields from the Subject Area to the Measure and Category in Chart ribbon on the left side of the canvas. The canvas is where users drag and drop measures and attributes to build a visualization or a table. Simply find the measures and attributes that you want, drag and drop them.
With a table, it is a little more straightforward because users have a series of columns. They can also apply filters and sorting simply by dropping a column onto the filter section or to the sort of section.
Learn at your pace

Dragon Den is an Agile Dragon Group community focused on all aspects of Birst knowledge and development. Whether it is our free content or our paid training, we are here to support you throughout your Birst journey, from building your first dashboard to building your Birst solutions.

- Creating dashboards
- Creating reports
- Adding filters
- Manage user access