

Welcome to our article where we will discuss navigating Birst Visualizer, a powerful tool in Birst...
Agile Dragon Group has tools to show how to create a simple chart using Visualizer. Building a chart in Visualizer is a straightforward process. To make most charts work, at least one measure or data that can be calculated and one attribute or data that gives context to a measure is required.
Users can either drag and drop measures and dimensions onto the canvas or use guided mode. In guided mode, users can select a chart type and the mode will prompt them to add at least one measure and one category or attribute to populate the chart. Once the chart is complete, users can save their visualizations. They can then select either the private folder or the shared folder to save their visualization.
Navigating to Birst
To begin building a chart using Visualizer, the user navigates to Birst and selects the desired space. From there, click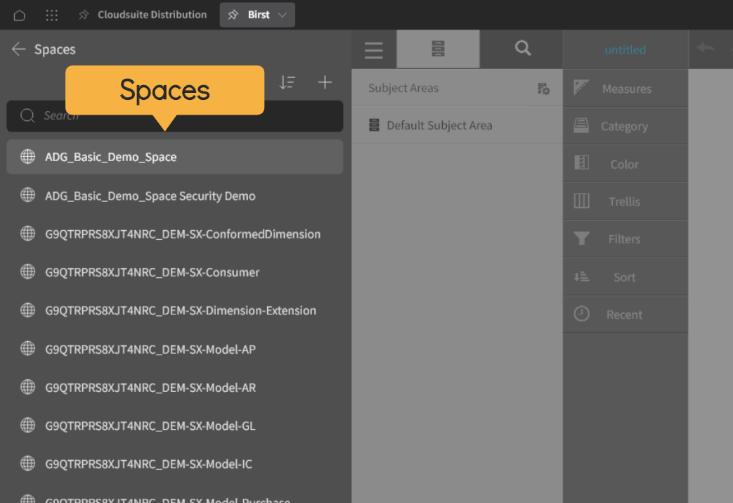
Creating a Simple Chart with Visualizer
Understanding Measures and Attributes
To create a chart in Visualizer, at least one measure and one attribute are required.
- Measures are data that can be calculated
- Attributes provide context to a measure.
- One can drag measures and dimensions onto the canvas or use guided mode to select a chart type.
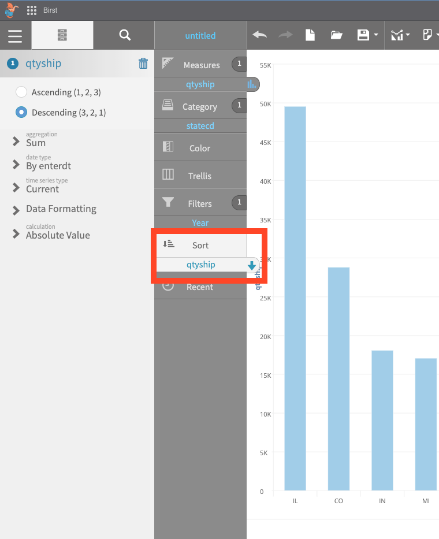
Sorting Data
To sort data in ascending or descending order, the user can drag and drop a column into the Sort section of the ribbon. The user can choose ascending or descending and the visualization will update accordingly.
Saving Your Visualization
After creating a visualization, the user can save it by clicking on Save and choosing Save As. The user can save the visualization to the private folder or the shared folder. If saved to the shared folder, anyone with access to that folder will also have access to the visualization.
Choosing Save Location
After creating a visualization in Visualizer, users can save their work by clicking on the "Save" button and selecting "Save As" to save in a different folder. “Save As” presents users with the option for where to save their visualization. There are two main areas to consider:
- Private folder
- Shared folder
Saving a visualization to the private folder means that it will only be available to the user who created it. On the other hand, saving a visualization to the shared folder section allows users to save their work to a list of filters within the shared section that they can access later.
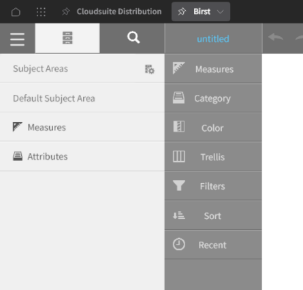
Selecting Chart Type
Once in Visualizer, the user can select a chart type from the list provided. In guided mode, the user is prompted to add at least one measure and one category or attribute to populate the chart.
Learn at your pace
Dragon Den is an Agile Dragon Group community focused on all aspects of Birst knowledge and development. Whether it is our free content or our paid training, we are here to support you throughout your Birst journey, from building your first dashboard to building your Birst solutions.
- Creating dashboards
- Creating reports
- Adding filters
- Manage user access