Dashboard bookmarks are a feature that allows a dashboard viewer to save a particular view that...
Whether you want to add a new attribute, change the chart type, or make any other adjustments, the process is simple and straightforward.
To begin editing a dashboard, you need to enter edit mode. Once in edit mode, you can select any of the dashlets on the dashboard and make changes using the edit and visualizer options. In this article, we will focus on adding an attribute to a details table and changing the chart type.
Key Takeaways
- To edit a dashboard, enter edit mode and select the dashlet you want to modify.
- Use the edit and visualizer options to make changes, such as adding attributes or changing the chart type.
- Always save and publish your changes to make them visible to others who have access to the dashboard.
Entering Edit Mode
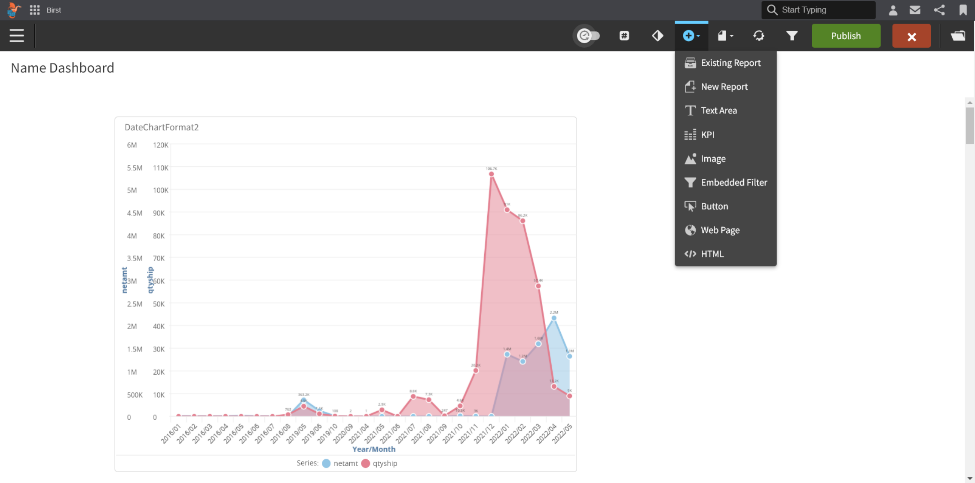
To make edits to a dashboard, you will need to put the dashboard into edit mode. If you have the appropriate permissions, you will see an edit button in the upper right-hand corner of the dashboard. Click on the edit button to enter edit mode.
Once in edit mode, you will be able to select any of the dashlets on the dashboard. To make an edit to a specific dashlet, simply click on the dashlet. This will present you with an edit button. Click on the edit button to open up the editing options.
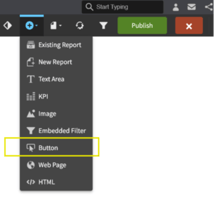
There are four options available when editing a dashlet. The second option is "Edit and Visualizer". Click on this option to be taken to the Visualizer where you can start making edits to the dashlet.
To add data to a table, navigate to the default subject area where you will be presented with three options: measures, attributes, and other expressions. For example, to add the column of "product" to the table, click on "attributes" and find the "product" folder. Double-click on "product" to add it to the table.
Once you have made your changes, click on the green "Save and Insert" button in the upper right-hand corner to save the changes and insert them onto the dashboard.
To save the changes, click on "Publish", which is the equivalent of "Save and Birst". This will update the dashboard for anyone who has access to it.
Making edits to any item on the dashboard follows the same procedure. Always remember to edit the dashboard, select the dashlet that you want to make an edit to, choose "Edit", choose "Edit and Visualizer", make your change, save it, and publish it. It's that simple!
Accessing Edit Options
To make an edit to a dashboard, you need to put the dashboard into edit mode. Assuming you have the appropriate permissions, you will see an edit button in the upper right-hand corner. Clicking on this button will give you the ability to select any of the dashlets on the dashboard.
Once you have selected the dashlet you want to edit, click on it to reveal an edit button. Clicking on this button will present you with four options. Choose the second option, which is "edit and visualizer."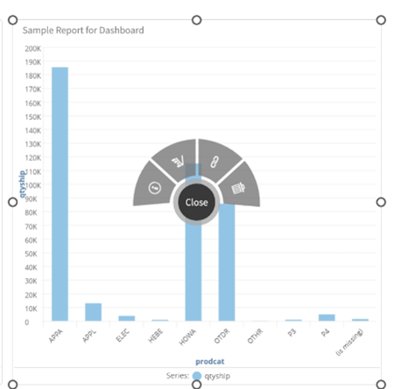
You will then be taken to visualizer where you can start making edits to the table. Navigate to the default subject area, where you will be presented with three options. These are the options available to add data to the table. You can add measures, attributes, or other expressions.
Once you have made your changes, click on the green save and insert button in the upper right-hand corner to save this change and insert it onto the dashboard. If you want to save this change permanently, click on publish, which is the equivalent of save and Birst.
Making edits to any item on the dashboard follows the same procedure. It's always edit the dashboard, select the dashlet you want to make an edit to, choose edit, choose edit and visualizer, make your changes, save and insert, and publish. It's that simple!
Navigating to Default Subject Area
To make an edit to a dashboard, you need to put it into edit mode. Assuming you have the appropriate permissions, you will see an edit button in the upper right-hand corner. Once you select it, you can select any of the dashlets on the dashboard.
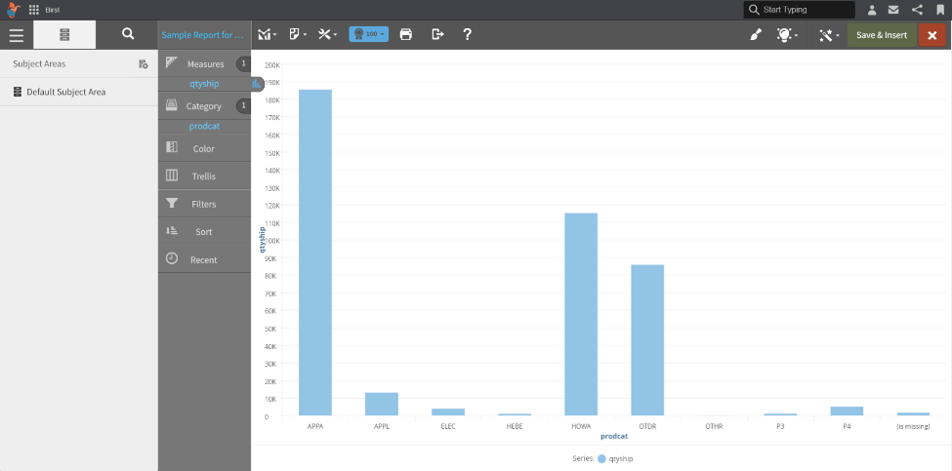
To edit the details table in the bottom left, simply click the dashlet. You will be presented with an edit button. When you click on it, you will have four options available, and we will focus on the second one, which is "Edit and Visualizer."
Clicking on "Edit and Visualizer" takes you to the visualizer where you can start making edits to the table. To navigate to the default subject area, you will be presented with three options. These are the options available to add data to the table. You can add measures, attributes, or other expressions.
.
Double-click on "product," and it will be added to the table. You will notice a green "save and insert" button in the upper right, which you will click to save this change and insert it onto the dashboard.
Now, the details dashlet in the bottom left has the product column in it. To save this change, click "publish," which is the equivalent of "save and Birst." Anybody who has access to this dashboard will see the updated change of adding the product column to the details table.
Making edits to any item on the dashboard follows the same procedure. It's always edit the dashboard, select the dashlet that you want to make an edit to, choose "edit," choose "edit and visualizer," make your change, in this case, let's just change the chart type. Choose "visualization" in the upper right to change visualization, change it to a bar chart, save and insert. You will notice the change and publish it. It's that simple!
Adding an Attribute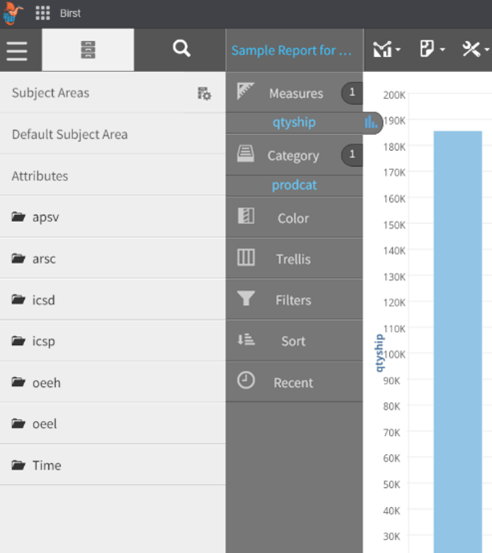
To add an attribute to a dashboard, you need to put it into edit mode by clicking on the edit button in the upper right-hand corner assuming you have the appropriate permissions. Once in edit mode, select the dashlet you want to add the attribute to. In this case, we want to add the product column to the details table on the bottom left. Click on the dashlet and then click on the edit button. From there, choose the second option, which is edit and visualizer.
You will be taken to the visualizer where you can start making edits to the table. Navigate to the default subject area where you will be presented with three options to add data to the table: measures, attributes, or other expressions. Since we want to add the product column, which is an attribute, click on the attributes folder and find the product folder. There are four columns in the product folder that you can add to the table, and you will see product listed right there. Double-click on it to add it to the table.
Once you have made your changes, click on the green save and insert button in the upper right to save this change and insert it onto the dashboard. You will now see that the details dashlet in the bottom left now has the product column in it. To save this change, click on publish, which is the equivalent of save and Birst. Now anyone who has access to this dashboard will see the updated change of adding the product column to the details table.
Making edits to any item on the dashboard follows the same procedure. It's always edit the dashboard, select the dashlet you want to make an edit to, choose edit, choose edit and visualizer, make your change, save and insert, and then publish. It's really that simple.
Saving and Inserting Changes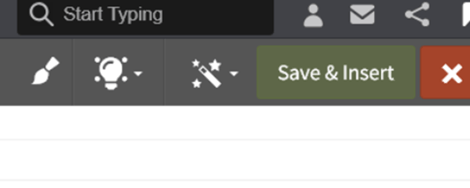
To make an edit to a dashboard, you need to put the dashboard into edit mode by clicking on the edit button in the upper right-hand corner. Once in edit mode, you can select any of the dashlets on the dashboard that you want to edit. To edit the details table on the bottom left, simply click on the dashlet and then click on the edit button. From there, select "Edit and Visualizer" which will take you to the visualizer where you can start making edits to the table.
To add a column to the table, navigate to the default subject area and select "Attributes". Find the folder that contains the column you want to add and double-click on it. Once you have made your changes, click on the green "Save and Insert" button in the upper right-hand corner to save your changes and insert them onto the dashboard.
To save the changes permanently, click on "Publish" which is equivalent to "Save and Birst". Anyone who has access to the dashboard will now see the updated changes. It's that simple!
Publishing the Dashboard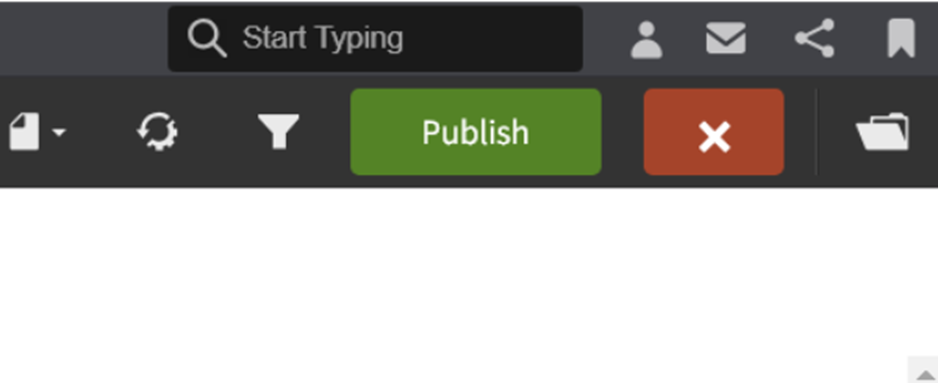
To publish changes made to a dashboard, you need to follow a few simple steps. First, put the dashboard into edit mode by selecting the edit button in the upper right-hand corner. Once in edit mode, select the dashlet you want to edit by clicking on it. In this example, we want to edit the details table in the bottom left corner.
After selecting the dashlet, click the edit button and choose "edit and visualizer." This will take you to the visualizer where you can start making edits to the table. Navigate to the default subject area and select the attribute you want to add to the table. In this example, we want to add the product column, so we select the product folder and double-click on the product attribute.
Once you've made your changes, click the green save and insert button in the upper right-hand corner. This will save your changes and insert them onto the dashboard. To publish the changes, click the publish button, which is equivalent to save and Birst.
After publishing, anyone who has access to the dashboard will see the updated changes, such as adding the product column to the details table. Remember that making edits to any item on the dashboard follows the same procedure: edit the dashboard, select the dashlet you want to edit, choose "edit and visualizer," make your changes, save and insert, and finally, publish.
It's that simple!
Changing the Chart Type
To change the chart type of a dashlet in a dashboard, you first need to enter the edit mode. Once in edit mode, select the dashlet that you want to make changes to. Click on the dashlet and select the "Edit" button. From there, select the "Edit and Visualizer" option.
In the Visualizer, navigate to the upper right corner and select the "Change Visualization" button. You can now select the chart type that you want to use from the list of available options. Once you have made your selection, click the "Save and Insert" button in the upper right corner to apply the changes to the dashboard.
Remember to click the "Publish" button to save and publish the changes to the dashboard. Now anyone with access to the dashboard will see the updated chart type.
Changing the chart type is a simple process that can be applied to any dashlet in the dashboard. Simply enter edit mode, select the dashlet, choose "Edit and Visualizer", change the chart type, and save and publish the changes.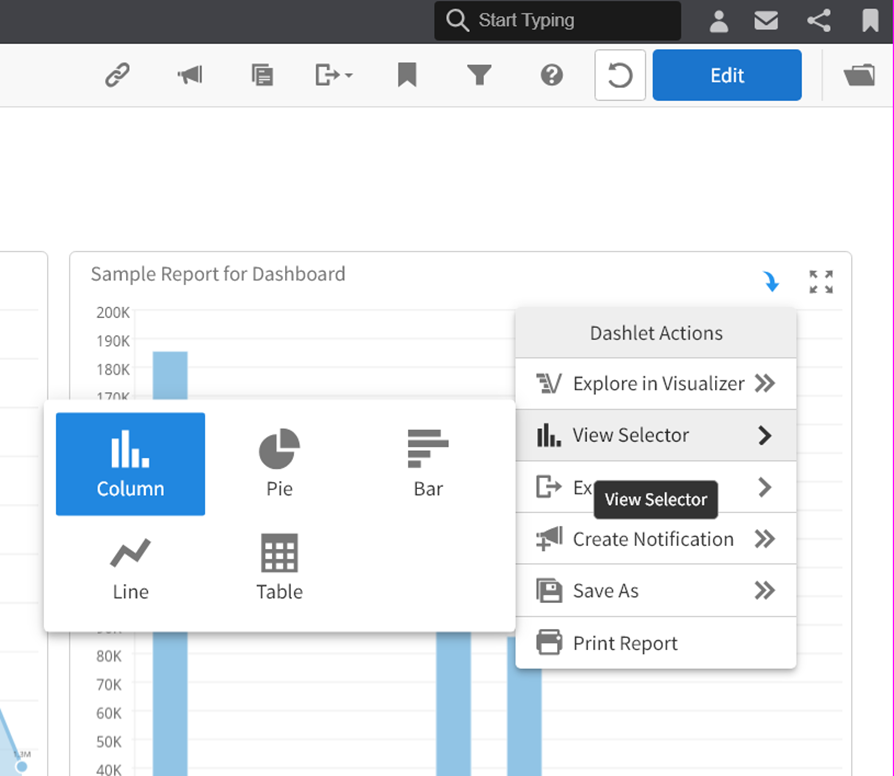
Finalizing Edits
To finalize edits to a dashboard, you need to follow a few steps. First, put the dashboard into edit mode by selecting the edit button in the upper right-hand corner. Once in edit mode, you can select the dashlet that you want to make an edit to. In this example, we want to edit the details table in the bottom left, so we'll simply click on the dashlet.
After clicking on the dashlet, you will be presented with an edit button. Clicking on this button will give you four options, and we're going to focus on the second one, which is edit and visualizer. Clicking on this option will take you to visualizer, where you can start making edits to the table.
To add a column to the table, navigate to the default subject area, where you will be presented with three options: measures, attributes, and other expressions. In this example, we want to add the column of product to the table, which is an attribute. Click on attributes and find the product folder. There are four columns in the product folder that you can add to the table, and product is listed right here. Double-click on it, and it will be added to the table.
Once you have made your changes, click on the green save and insert button in the upper right-hand corner to save the change and insert it onto the dashboard. You can now see that the details dashlet in the bottom left now has the product column in it.
To save this change, click on publish, which is the equivalent of save and Birst. Now anybody who has access to this dashboard will see the updated change of adding the product column to the details table.
Making edits to any item on the dashboard follows the same procedure. Always edit the dashboard, select the dashlet that you want to make an edit to, choose edit, choose edit and visualizer, make your change, save and insert, and publish. It's that simple.
Learn at your pace

Dragon Den is an Agile Dragon Group community focused on all aspects of Birst knowledge and development. Whether it is our free content or our paid training, we are here to support you throughout your Birst journey, from building your first dashboard to building your Birst solutions.

- Creating dashboards
- Creating reports
- Adding filters
- Manage user access