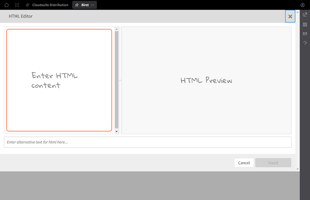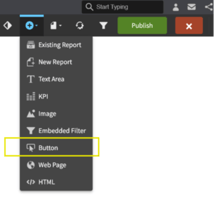
Dashboards - Add Buttons
Dashboards - Adding new and existing reports
In this article, we will discuss how to add new and existing reports to a Birst dashboard. With just a few clicks, you can easily add reports to your dashboard and customize their placement and size.
To add an existing report, simply click the large button in the center of the dashboard and select the report from your private or shared folder. You can then move and resize the report as needed. To add a new report, click the plus button in the ribbon and build your report in Visualizer. Once you have saved the report, it will be inserted into the dashboard and can be edited and customized just like any other report.
Key Takeaways
- Adding existing reports to a Birst dashboard is as simple as selecting the report from your private or shared folder.
- Adding new reports can be done through Visualizer and then inserted into the dashboard.
- Reports on the dashboard can be moved, resized, and edited to fit your needs.
Navigating to Birst Dashboard
We will now demonstrate how to add existing reports and new reports to a Birst dashboard. To begin, we navigate to Birst and start a new dashboard. To add existing reports to the dashboard, we simply click the large button in the center of the dashboard and select the report from our report catalog. We can choose from our private or shared folder and select the report we want to add, such as "Product cost by category". Once we click "Done", the report is added to the dashboard, and we can move it around or edit its properties using the handlebars or the edit button.
To add a brand-new report to the dashboard, we click the plus button in the ribbon and select "Insert new report". This takes us to Visualizer, where we can build the report we want to add to the dashboard. We start by selecting our measures and attributes, such as "quantity shift" and "product category". Once we have built the report, we click "Save" and insert it into the dashboard. We can move and resize the report as needed and edit its properties using the same process as with existing reports.
Adding new or existing reports to a Birst dashboard is a simple process that can be done quickly and efficiently. The only challenge may be building more complex reports, but the process for adding them to the dashboard remains the same.
Adding Existing Reports to Dashboard
Accessing Report Catalog
 To add existing reports to a Birst dashboard, we simply click the large button in the center of the dashboard labeled "Add Existing Reports." This takes us to the report catalog where we can select the private or shared folder and choose the report we want to add.
Choosing Reports
Once we've selected the report we want to add, we click "Done" to indicate that we want to put that report onto the dashboard. We can now move it anywhere we want on the dashboard and use the handlebars to resize it.
Report Placement and Editing
If we want to edit any properties of the report, we can click the "Edit" button in the center of the report. Similarly, if we want to add a brand-new report to the dashboard, we simply click the plus button in the ribbon and select "Insert New Report." This takes us to Visualizer where we can build the report we want to put under the dashboard. We can add measures and attributes, build charts or tables, and save the report. Once saved, new reports can be added to the dashboard, moved, and resized just like any other report.
Adding new or existing reports is an effortless process that always remains the same. While more complex reports may require more effort, the process itself is straightforward and easy to follow.
Adding New Reports to Dashboard
Inserting New Report
To add a new report to a Birst dashboard, we simply click the plus button in the ribbon and select "Insert New Report". This will take us to Visualizer where we can build the report we want to insert. We can choose to build a chart or a table, but we first need to select our measures and attributes. After selecting our measures and attributes, we can save and insert the report. We will be asked to save the report that we just created, and then it will be inserted into the dashboard.
Building the Report
When building the report, we can choose from many formats such as charts or tables. We can also select our measures and attributes to create the desired report. Once we have built the report, we can save it and insert it into the dashboard.
Saving and Inserting the Report
To save and insert the report, we simply click the save and insert button. We will be prompted to save the report in a folder and give it a name. Once we have saved the report, it will be inserted into the dashboard. We can then move it to any desired location on the dashboard, adjust its size, and edit its properties using the handlebars or the edit button in the center.
We can add existing reports by clicking the large button in the center of the dashboard and selecting the report we want to add. We can also insert new reports by clicking the plus button in the ribbon and selecting "Insert New Report". Once we have built and saved the report, we can insert it into the dashboard, move it to any location, and edit its properties as desired.
Learn at your pace

Dragon Den is an Agile Dragon Group community focused on all aspects of Birst knowledge and development. Whether it is our free content or our paid training, we are here to support you throughout your Birst journey, from building your first dashboard to building your Birst solutions.

- Creating dashboards
- Creating reports
- Adding filters
- Manage user access