
Agile Dragon Consulting’s Dragon Grid Announcing Agile Dragon Consulting’s Dragon Grid, a set of...
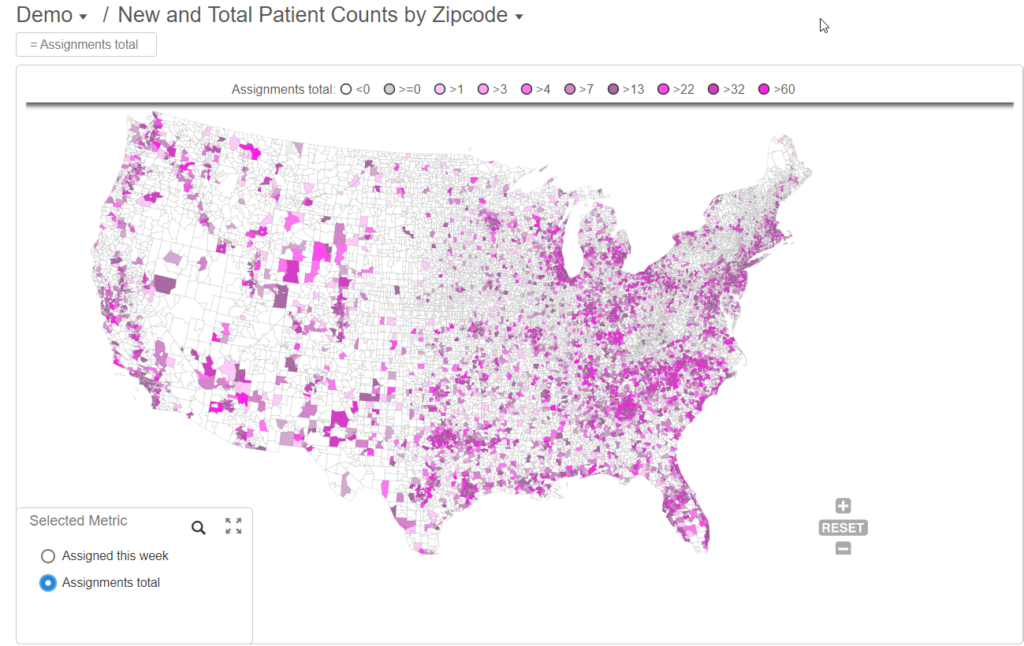
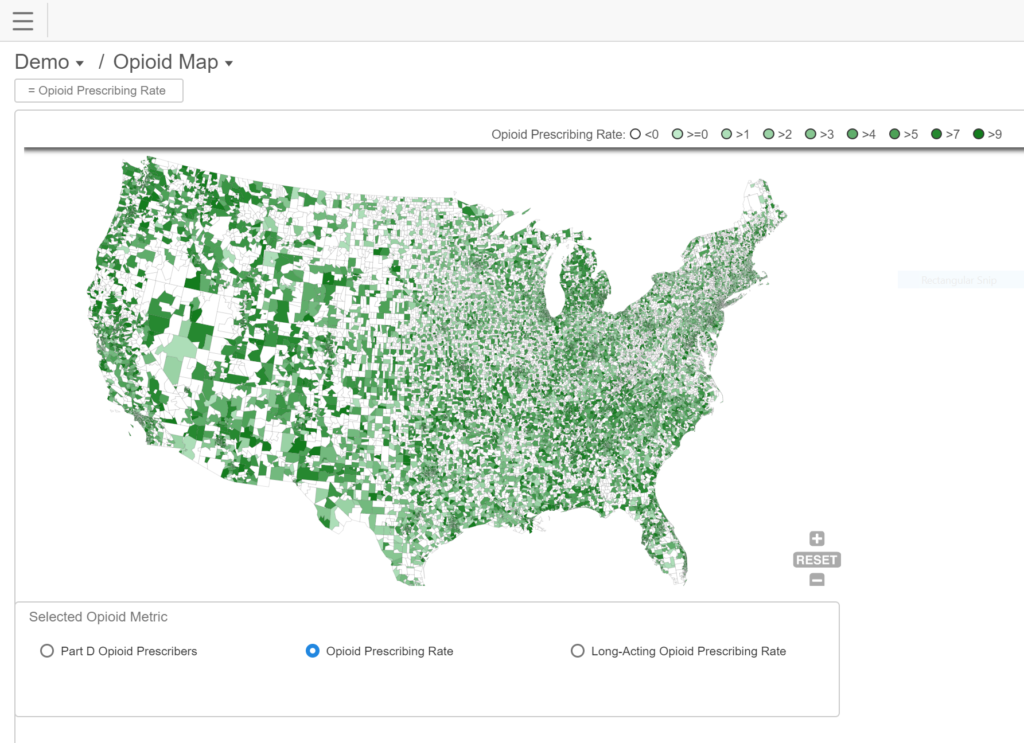
Announcing Agile Dragon Consulting’s Ziptelligence, a zip code-level map data visualization tool
Some Early Introductions and Features
As a Birst Services resource I have worked on many projects and, as I’ve implemented again and again, I’ve found that there are certain things that seem like they should be easy to the client or user but, in reality, are actually very difficult or even impossible. Zip Code mapping is definitely on that list.
The problem, which is well known to any intrepid implementer, is that Infor Birst supports down to the county-level out of the box but won’t go any further. While this may be sufficient in rural areas, when you consider any city you will realize that most organizations needs finer granularity if they want to understand their data in the context of a map. What if you want to visualize how many customers are within a particular zip code? Or how many sales a salesperson has made in their territory? We have found that it is a common scenario for organizations to use zip codes as boundaries for service or sales territories. While custom KML files can be used with Visualizer, a USA-wide zip code level KML file is just too big.
While lat/long coordinates can be used, those are for a specific point on the map, not for an area of the map. While this is fine for show exactly where something in on the map, when trying to visualize data related to a particular area it just doesn’t work.
To resolve this issue we made our own map, stored it on our own server, built an integration to Infor Birst’s Javascript API, and have made it available for customers to embed in their own Birst Dashboard Solutions.
Presenting Ziptelligence, a zip code-level map data visualization tool brought to you by Agile Dragon Consulting:
- If you have a Birst License and have built a space with Zip Code as an attribute, you are tool, data, and platform ready!
- If you can write BQL, or at least cut and paste, you have the technical skills!
If your organization runs by Zip Code but you cannot visualize your information by Zip Code, then you are a driver operating without your driving glasses.
Zip Code Groupings:
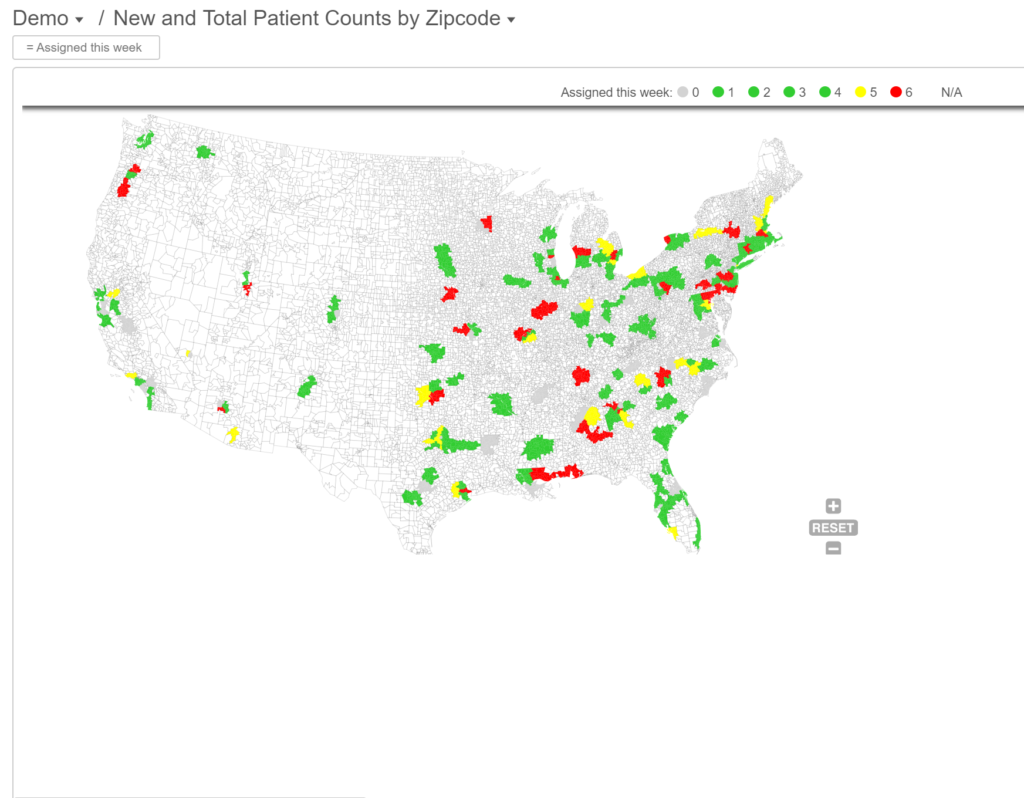
If your organization uses Zip Codes to look at the US, then it’s very likely they also divide the US along Zip Code lines. Perhaps they clump 3 or 4 or 200 zip codes into territories. Agile Dragon Consulting’s Ziptelligence supports driving territory groupings through the data and not through some other method like layering, etc. That way, if you re-allocate your Zip Codes into different groupings the data automatically updates the map. If you decide to add multiple versions of your mapping, as long as your Birst data supports the new view, you are good to go.
All maps support the full use of BQL as well as general and embedded filtering and prompts.
Easy to add to your Birst dashboard – no coding necessary
- We have made it a priority to make using Ziptelligence in your solution as easy as possible. If you can put together a BQL query, either by writing it or by copying and pasting, you can embed this custom html in your Birst dashboard. The only other thing you need is to specify the colors you want your map to use!
- If your people can’t do it we are happy to video conference you through the process.
- For more complex options we are happy to customize the code in order to make the necessary adjustments.
Agile Dragon Consulting:
- We focus on rapidly building and developing solutions that empower your users.
- Our goal is to get it done RIGHT and get it done QUICKLY!
- Ultimately, we are bringing to market a light, flexible product that we know will make the last mile of getting data to the end-user infinitely easier.
Next Steps
Whether you are a current customer or prospective Birst Customer, drop us a line and we will jump at the chance to help you show off your Ziptelligence.
Cheers – drop us an email!

