
Announcing Agile Dragon Consulting’s Dragon Grid, a set of embeddable, customizable grids (tabular reports) for use with Birst
Some Early Introductions and Features
If you are an experienced Infor Birst Developer or end user, you by now have a huge appreciation for Birst’s ability to integrate data from multiple sources, support thousands of users, and present information and visualizations in any number of places and ways. Additionally, you have likely been amazed at the agility with which your Birst Ninjas can leverage the platform to adjust and evolve with ever-changing business requirements and demands. With the addition of Birst’s Embedding API for JavaScript, the window to innovation was opened even wider. Not only were Birst’s native visualization tools at a developer’s fingertips, but now developers could leverage any number of D3 and Javascript inserts to solve edge cases and allow for significantly greater application flexibility.
As long-time Birst Services and Technical Mentoring resources we, time and time again, run into cases where our clients really just want access to their data as simply as possible. Yes, the logical Birst model has made business-critical dimensionality and aggregation possible, but in cases where the business is still formulating their needs, it is hard to optimize a model and analytical solution with the Business asking just to see lots of data so they can get a sense for what they want. The same things that make Visualizer an effective tool for building visualizations makes it poorly suited for easily pulling wide, long tabular reports that allow an analyst to really just page through and get a sense for their data. While Birst’s dimensional reporting in Visualizer significantly eases the process of creating charts and graphs, given the immense complexity of the data in any ERP or multiple-system solution, users are often overwhelmed by their choices and just want to see their data in a spreadsheet-like format.
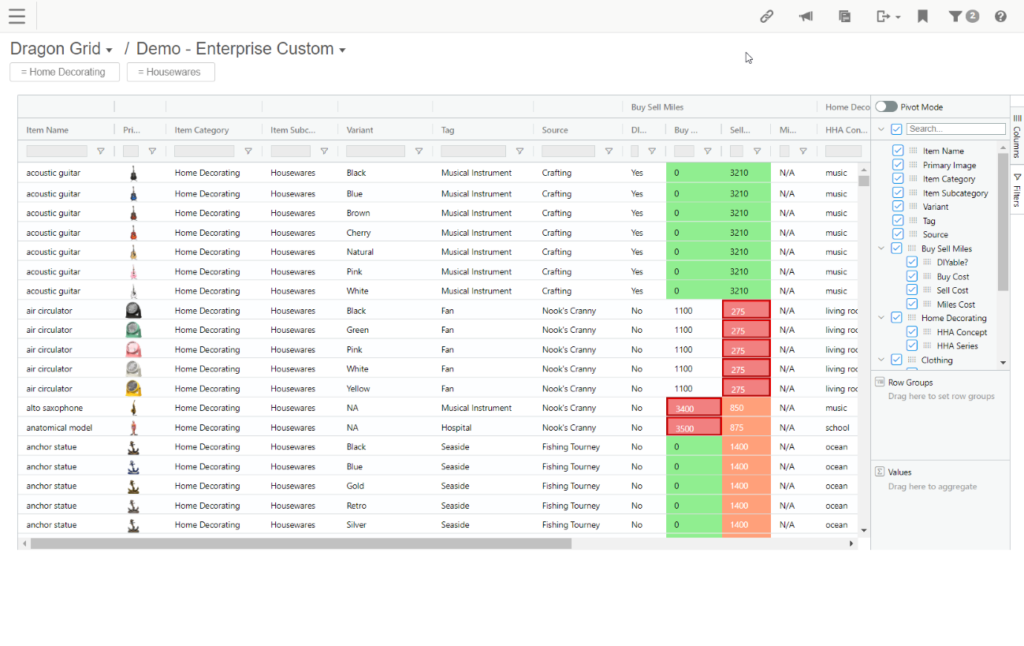
Enter Agile Dragon Consulting’s Dragon Grid, a set of embeddable, customizable grids (tabular reports) for times when requirements call for larger tables, faster viewing, advanced filtering, or end-user pivoting. Agile Dragon Consulting’s Dragon Grid products are inserted directly into the Dashboard 2.0 HTML window and put the control in the end-user’s hands. They can hide or reveal columns, move them or pin them, add or remove row groups, and change the entire look and feel of the grid – the power is in the end-user’s hands. We developed Dragon Grid for Analysts who want to see all the data, and with Birst’s inclusion into the entire Infor ERP family, additional applications are popping up daily.
- No coding necessary:
- If you have a Birst License and have built a space you are tool and platform ready!
- If you can write BQL, or at least cut and paste, you have the technical skills!
If you ask any owner of an analytical system that supports hundreds of users, they’ll tell you that it has to be easy. With today’s tight training budgets and even tighter schedules, if your dashboard solutions require special skills from your users then they will not engage. Dragon Grid gives them a whole slew of new features in a format that will be completely comfortable and intuitive.
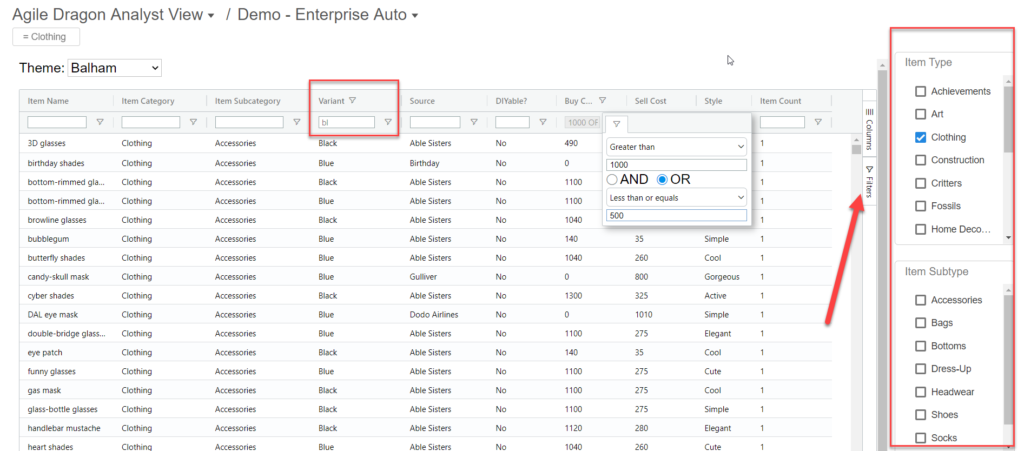
- Filter columns directly in the grid:
- Dragon Grid will work with Birst filters, either embedded on the dashboard or in Birst’s filter tray.
- In addition, Dragon Grid can include filter columns directly in the grid.
- Filters are automatically appropriate to the data type of the column – for example, a “contains” filter for text columns and “equal to” filters for numeric columns – and users can change the operator on the fly.
- They can even choose between “and” and “or” filters.
- Filters can be positioned at the top of each column or in a hideable tray on the side of the grid, or both! – dramatically reducing the amount of precious dashboard space that gets eaten up by a bunch of embedded filters.
- If the column is in the report then the user can filter by it.
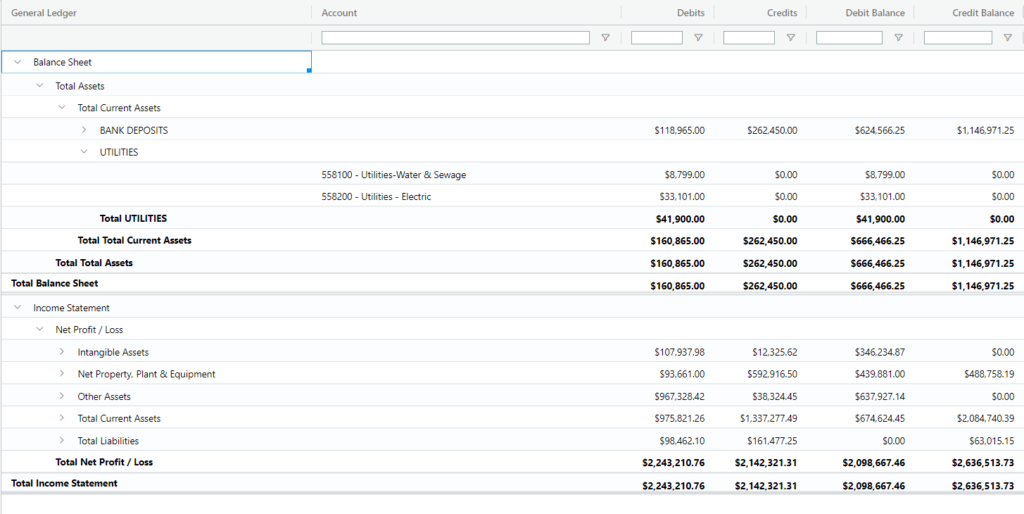
- Dragon Grid customized for financial reporting:
- While creating traditional financial reports in Birst’s Visualizer are challenging, the customizations available in Dragon Grid make it easy to produce Trial Balance or Balance Sheet reporting that looks familiar to end users.
- The ability to expand and collapse groups makes it easy to get to the information you want at the level of detail you need.
- This is one example of how we can further customize Dragon Grid’s impressive out-of-the-box features so you can provide your users with exactly the they need, where they need it.
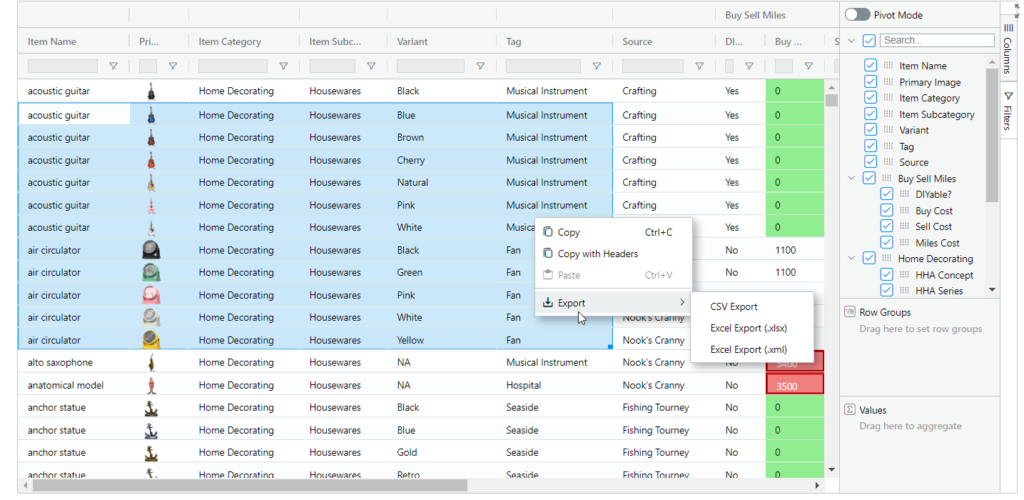
- Dragon Grid enables flexible exporting and copy/paste functionality:
- Ultimately, users want to be able to export their reports in order to share the information. Dragon Grid can easily be exported to the most common spreadsheet formats.
- If you just want to share a portion of the data, Dragon Grid’s cells can be selected and then copied, with or without headers, for pasting into your favorite application. It doesn’t get any easier than that!
Agile Dragon Consulting:
- We focus on rapidly building and developing solutions that empower your users.
- Our goal is to get it done RIGHT and get it done QUICKLY!
- Ultimately, we are bringing to market a light, flexible product that we know will make the last mile of getting data to the end-user infinitely easier.
Next Steps: Whether you are a current customer or prospective Birst Customer, drop us a line and we will jump at the chance to show off our new tabular visualization, Dragon Grid!

