How Many Records Can Birst Display
Currently, Birst can display only 50,000 rows of data, and Birst has yet to announce plans to increase that current limit.
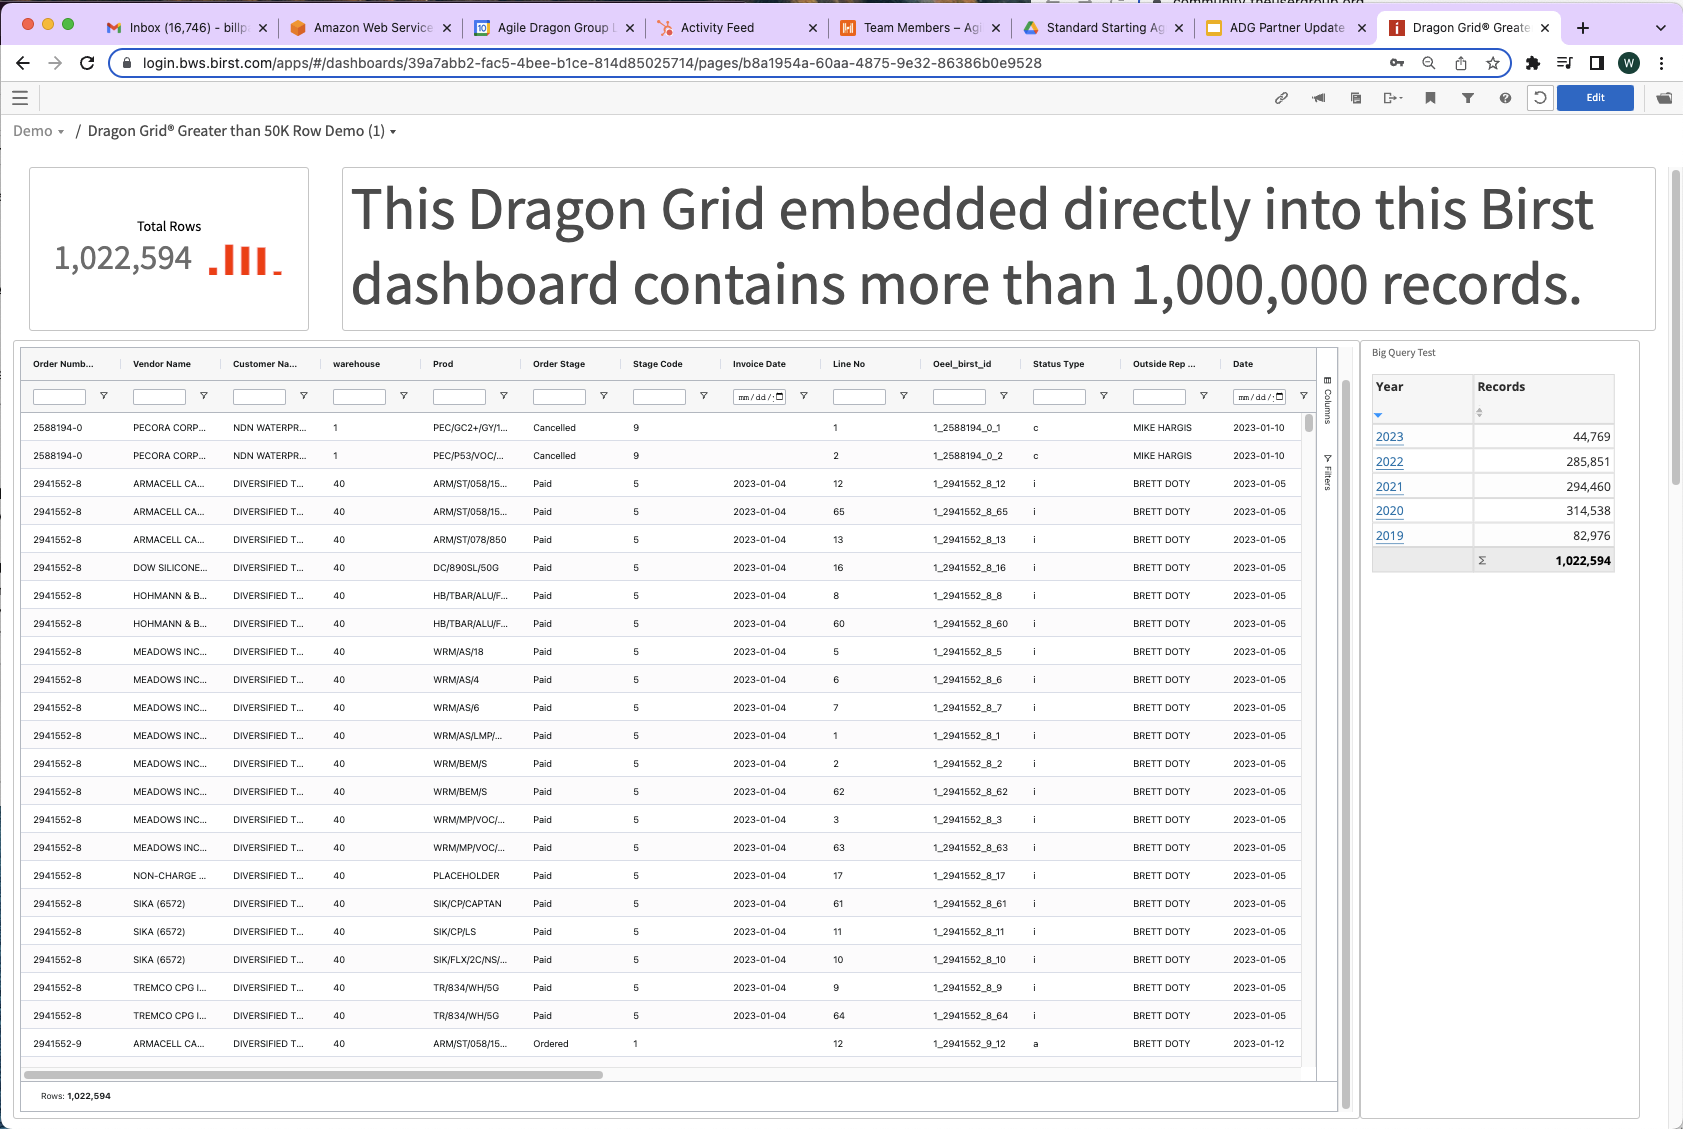
Can You Have More Than 50,000 Rows of Data in Birst?
Yes, leveraging the Dragon Grid is currently possible to have over a million rows of data in Birst.
Introducing the newest capability of Dragon Grid®, the ability to display, filter, and scroll through more than 50,000 rows of data in a Birst Dashboard. By implementing Dragon Grid, your users can get tables of 1 million records or more in a Birst dashboard with our simple-to-use javascript add-on built to leverage Birst's flexibility to the fullest. Whether your users are looking for a particular line item across a year or exporting large files to send down the line to another business process, Dragon Grid brings a fuller potential of data access than is readily supported out of the box.
Every Birst customer has resources that believe they need all the data for a particular analysis in their hands, and our big query functionality now allows them to have it. Additionally, our big query capabilities work with all our other excellent user-focused capabilities. Such as:
User and Developer Saveable Grid Configurations
Unlike standard Birst grids, Dragon Grid supports many capabilities enabling users to tweak grids to meet their particular needs and save. For example, users can move and hide columns, apply filters in their grids, and keep them! Or your Birst developer can create wide grids with columns that span multiple department concerns and leverage Dragon Grid's ability to show and hide columns to allow the user to select the columns that make sense for their grid. This will greatly reduce the general proliferation of minimally different reports while enabling users can get the grid to precisely what they need to support their day-to-day needs. If users need more than one version of a grid, they can leverage Birst's bookmark feature to create as many as they need. Our current customers have remarked how simple the functionality is to install it makes training unnecessary.
The Same Uses Filters, Prompts, and Data Models.
Since Dragon Grid has been built to use the same filtering and prompting and BQL syntax as a standard Birst dashboard and report, the Dragon Grid works the same as any other embedded Visualizer or Designer report. The forethought Birst put into their javascript API makes the data returned to the Dragon Grid from Birst the same as Visualizer or Designer would receive. This is everything from applied filters, expressions, and, most important, row-level security.
How Do You Get Better Financial Reporting in Birst?
Unlike standard Visualizer and Designer, Dragon Grid allows your financial team to see their data in the format of a typical financial reporting hierarchy with the full capability to roll up and roll down between accounts and categories and General Ledger transactions. If your finance team is working to close the books, then they can look at their account summaries and roll down the levels of summary to see the specific transactions.
Ragged Hierarchies
For use cases such as HR and manufacturer's Bills of Materials, Dragon Grid's ragged hierarchy support is a unique life-simplifying feature. Scrolling up and down reporting and organizational charts of significant depth or visualizing bills of materials of varying depths and part counts with ease within Birst. Additionally, all the metrics your people need to understand each piece or assembly are simple and easy to see.
Easier Export and Cut/Paste
Dragon Grid exports the entirety of the hosted data in a single click to the user's download directory in an Excel or csv format. Additionally, if your user only needs a few cells or rows off of a larger grid, then they can just cut and paste what they need right out of the browser!
Dragon Grid® is a huge step forward for Birst users and is like nothing else on the market. Click the button below and schedule a free demo and get a free trial to see how it can change your business.